Let numbers be your guide
January 2010 | dentalproductsreport.comThink like a CEOLet numbers be your guideHard data should trump emotions when it comes to business assessment and planning.by Callie Haynes, Pride I
January 2010 | dentalproductsreport.com
Think like a CEO
Let numbers be your guide
Hard data should trump emotions when it comes to business assessment and planning.
by Callie Haynes, Pride Institute consultant


The subject
Nine months into a rough year, Dr. Everyman walks into his morning huddle, already feeling far from successful. He has been watching a lot of TV and has heard all the news about job layoffs, bankruptcies and other economic issues. On a personal note, last month he was unable to draw his normal salary and he has never been able to put away as much money in savings as he would like. At huddle, the team seems distracted and unresponsive to his concerns.
When the first update Dr. Everyman receives is the cancellation of a patient who was to be his most productive procedure for the day-he snaps.
“That’s it,” he says. “We are obviously another casualty of the economy, and there is nothing left to do but downsize and ride the vortex down.”
Melodramatic? Yes. But other than that, what’s wrong with this picture?
The diagnosis
Dr. E has made a sweeping decision about the health of his practice based on his feelings-judgments based on perceptions, not facts. Before he throws out too many babies with the bathwater, he and his team must analyze the key statistics of the practice to discern what its true strengths and challenges are and, more importantly, to prioritize solutions to address the real issues.
Can this practice be saved? Yes, if Dr. Everyman can let the numbers be his guide. When he and the team decided to truly analyze key practice statistics, they ran some reports. Here is what they discovered:

The self examination
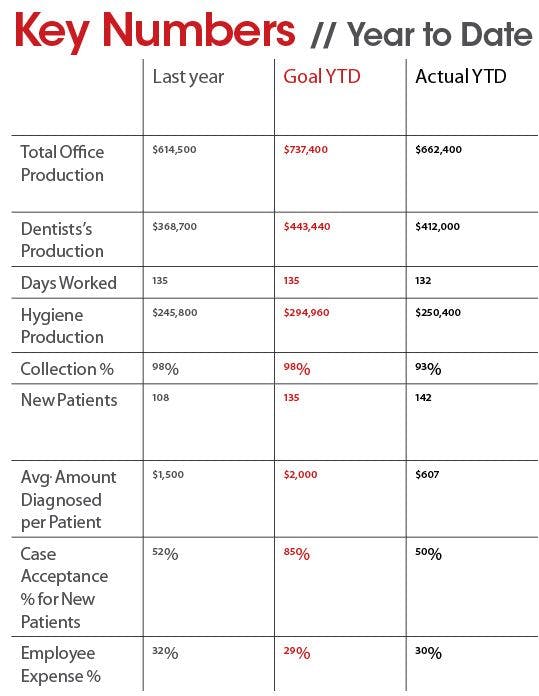
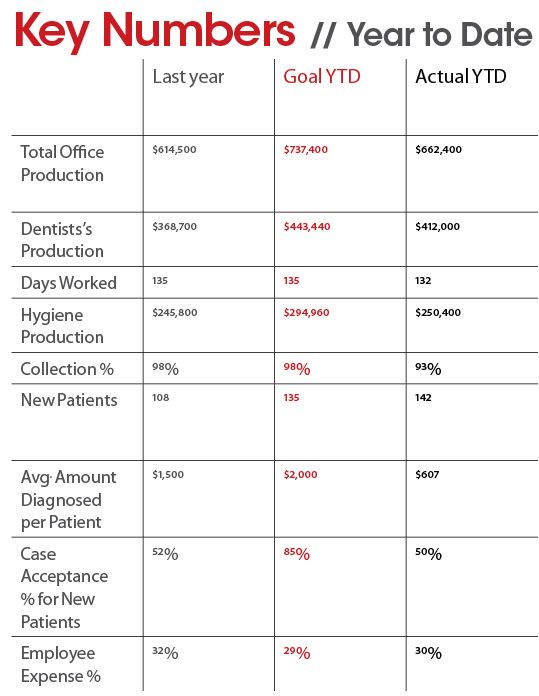
Total office production
At their staff meeting to analyze their Year to Date (YTD) practice statistics, the team looks first at Total Office Production (TOP). While both doctor and team are concerned that they are 10% under their Goal YTD, they realize they are 8% over what their TOP was for the same period last year. Dr. Everyman feels better already-this is quite good considering the economic challenges.
Dentist’s production
Again, a statistic that is below goal by 7% for the current nine-month period. This time, Dr. E holds his comments as they compare this statistic with the same period last year. More good news-up by 11%.
Days worked
Looking at the number of days Dr. E has worked so far, the team reminds him that he took an unplanned fishing trip on the spur of the moment, so three days of production were cancelled. Dr. Everyman recalls he didn’t catch a single fish that trip!
Hygiene production
“Okay,” thinks Dr. E, “now, it’s my turn to put the hygienists on the spot. They are 15% below goal.”
Before he speaks, the dental hygienists gently remind him to compare their production with the same time period last year. They are a modest 2% ahead, but still ahead of last year.
CONTINUED ON NEXT PAGE
{NEW_PAGE}
Collection %
The whole team clearly sees the next statistic, collections, is down 5%. That amounts to $33,120.
“No wonder I can’t draw my regular salary or put any money away for retirement,” Dr. Everyman thinks. The hair on the back of his neck bristles, but he takes a deep breath and realizes he needs more information before he starts the blame game. He calmly says, “Sandy, let’s run an aged accounts receivable report and sit down together to review it. Once we see where the money is, we can have a brainstorm at our next staff meeting to see how we can support you in collecting this money and getting back on goal. How does that sound?”
Sandy feels relieved-she could use some help with the phones while she follows up on outstanding insurance claims and past-due patient balances.
New patients
Next is the number of new patients-wow! They are seven over goal and have 34 more than the previous nine-month period. Dr. Everyman makes a mental note to start tracking where these patients are coming from, as the practice must be doing something right.
Average amount diagnosed per new patient
The team immediately spots a huge variation: $607 per New Patient is $1,393 short of goal and is $893 short of the previous nine-month period. What does this mean?
“Let’s look back on our appointment schedules and analyze how our new patients were scheduled,” Dr. Everyman suggests. He’s thinking they may have reverted back to scheduling new patients with the hygienists first. If that is the case, he realizes he would not have had enough time to do some very important relationship building.
Case acceptance % for new patients
This statistic is 30% below goal and 2% down from the previous nine-month period. The doctor believes if he takes more time building relationships with new patients during the comprehensive exam, it will result in higher case acceptance. He acknowledges he may also have some work to do on his treatment presentation. There also may have been some treatment plans presented at separate consultation appointments that were not included in this statistic, which means the team may have some work to do on its tracking system.
The team’s big realization is, had they gotten the case acceptance they expected (by creating relationships that promoted commitment and follow-through), the TOP and Dentist’s Production goal easily would have been met.
Employee expense %
Dr. Everyman prefers to look at this data in private. He sees this expense is 1% over goal, however it is 2% less than the previous nine-month period. He realizes that by increasing production, the employee expense percentage will be at goal or below.
The follow-through
The doctor and his team spend the rest of their staff meeting developing an action plan to improve their statistics, with collections and case acceptance noted as priority areas. Specific action steps are assigned to team members along with timelines. Dr. Everyman and his team feel empowered to make improvements they know will improve their statistics.
Dr. Everyman now knows his numbers don’t lie, and there is always a story behind them. He makes the decision to always let the numbers be his guide and to make decisions based on facts and not gut feelings or emotions.
Related Articles
- New Year's resolutions for your practice
- Bringing back bartering